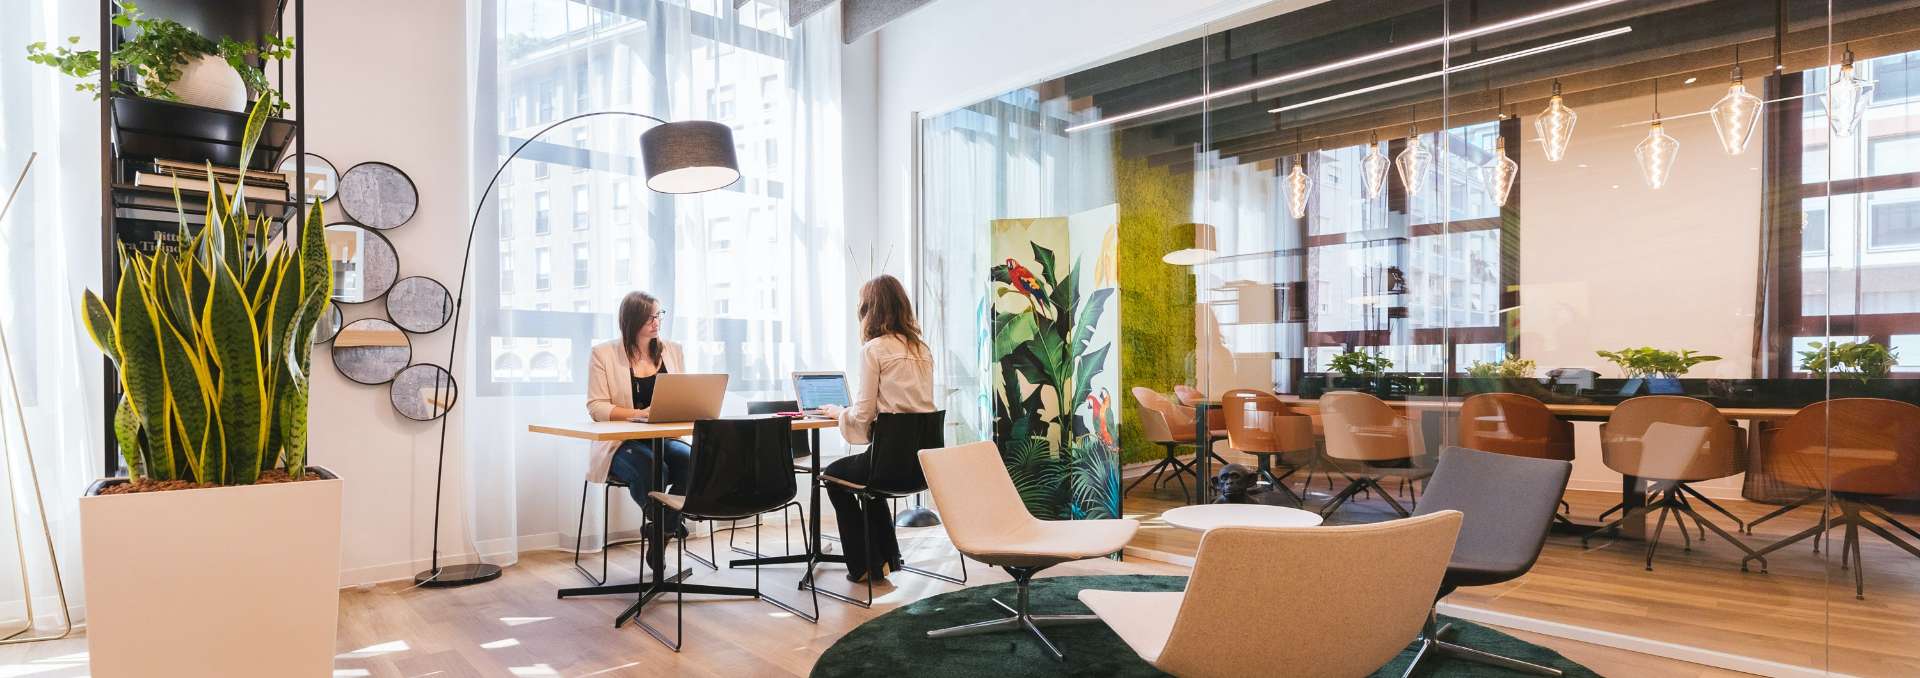
Making spaces more comfortable and productive.
1
Real-time data collection and monitoring
Ambient Conditions
Temperature
Humidity
Light
Noise
CO2
Air Flow
Water Properties
Power and Energy Use
2
Multi-stage, Deep-Dive Data Analysis text
Real-Time Data Visualization
Interactive Dashboard
People Traffic Flow Map View
Trending and Data Analytics
Custom Alarms and Alerts
Data Analytics Reports
3
Impact Analysis and Control Strategies
Occupancy and Social Distancing
Better Well-being
Happier Employees
Integration with Building Systems
Improved Productivity
Reduced OPEX
Higher Revenues
Real-time State of the building
1 Multiple views of summary, digital floor plan, trends, analytics and reports.
2 Customizable real time data visualization of site, floor, zone and device views.
3 Customizable thresholds with corporate or International standards for site, floor and zone.
4 Notifications using e-mail / SMS / Social Media, in case of outages or out of bounds.
5 Highlighting problem areas on the dashboard.
6 Historical Trending – Short / mid / long term.
7 Compare different areas (floors/zones) in a site / building.
Actionable Insights and Detailed Analytics
1 Sensor map for each parameter with out-of-bounds indicator.
2 Color-coded heatmap for each parameter, for each floor.
3 Spatio-temporal heatmap with compliance to thresholds.
4 Correlate events and establish benchmarks.
5 Identify hotspots across building / sites / floors.
6 Interactive calendar map with daily average conditions.
7 Out-of-bounds analysis.